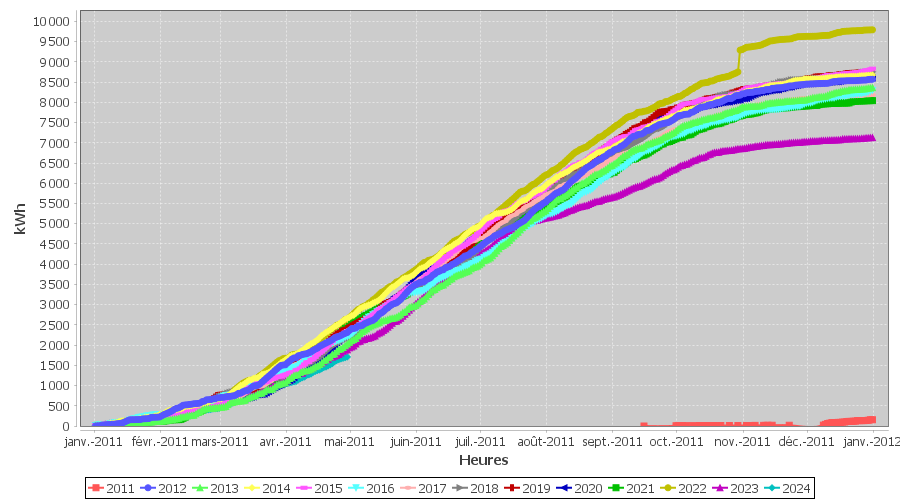
Vue annuelle
Vue annuelle
Rayonnement
##inverter_radiationgraphs##
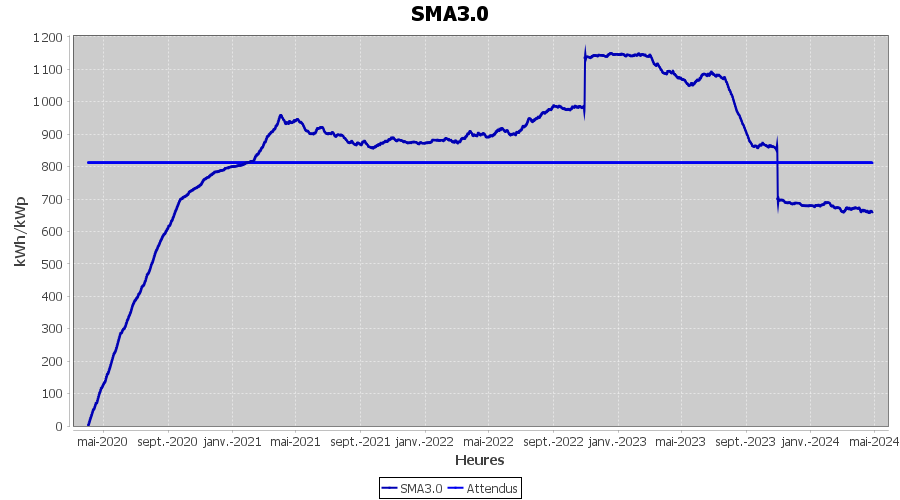
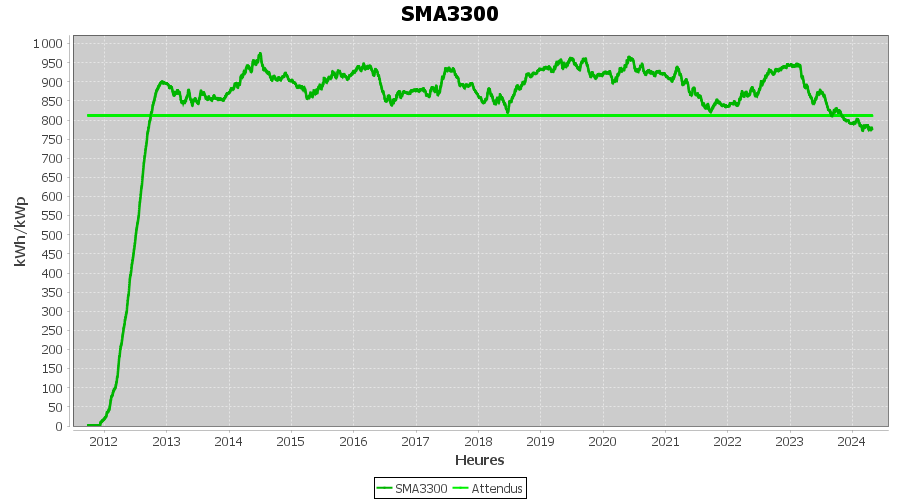
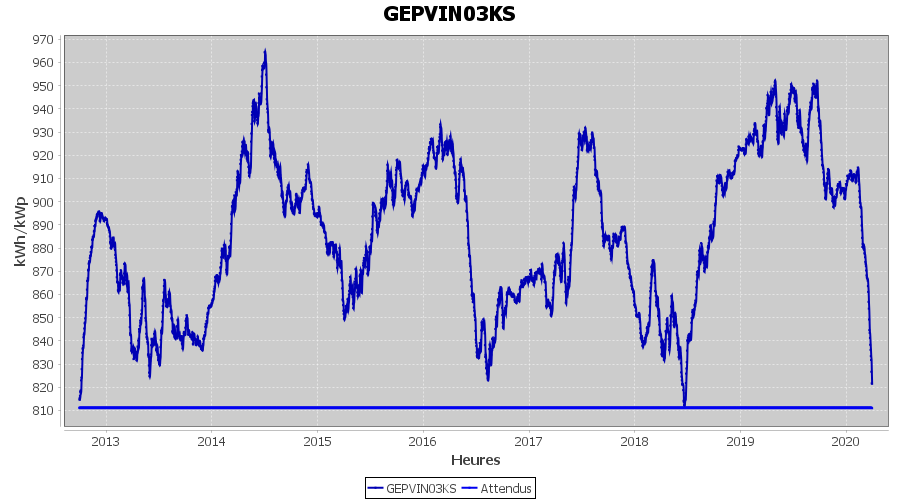
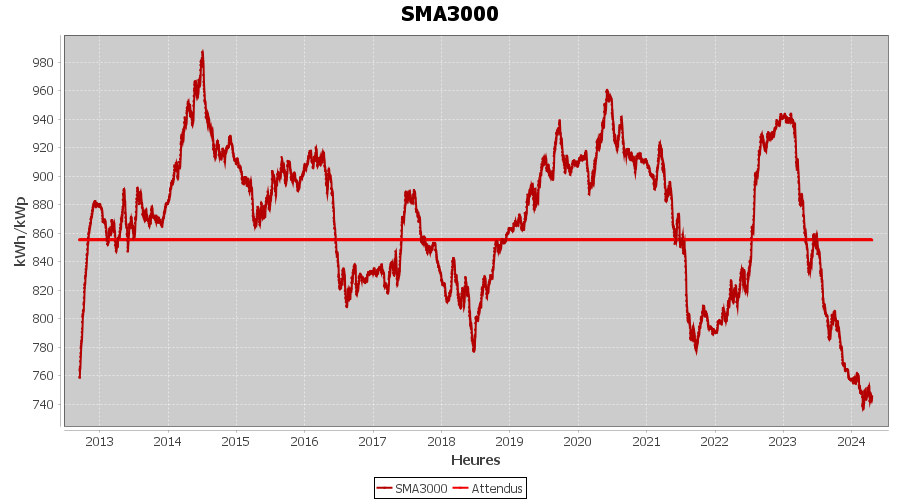
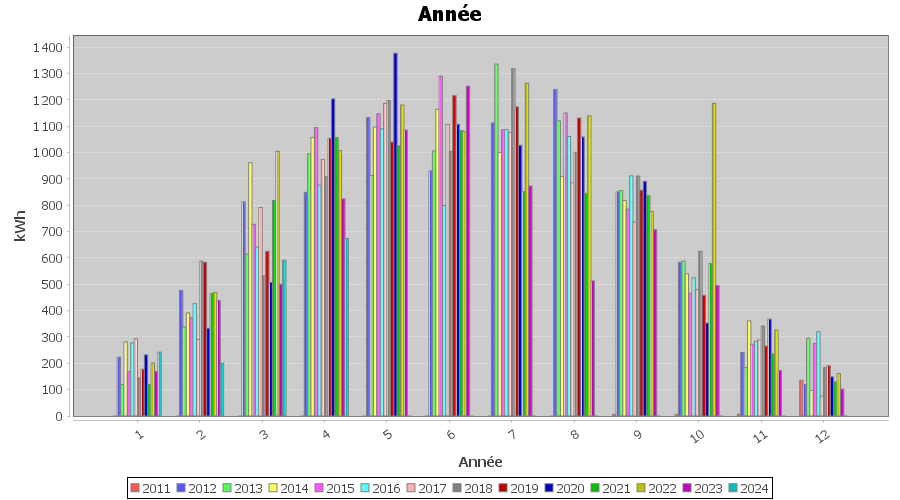
Rendement graphique annuel
Rendement graphique annuel
kWh/An aperçu
| Mois
| 2011
| 2012
| 2013
| 2014
| 2015
| 2016
| 2017
| 2018
| 2019
| 2020
| 2021
| 2022
| 2023
| 2024
| 2025
| 2026
| Average
| %
|
|---|
| 1
|
| 211
| 120
| 281
| 169
| 278
| 293
| 145
| 178
| 232
| 120
| 201
| 170
| 242
| 199
| 200
| 202
| 2,4
|
|---|
| 2
|
| 477
| 337
| 391
| 373
| 426
| 291
| 588
| 583
| 333
| 464
| 469
| 438
| 201
| 411
| 320
| 407
| 4,9
|
|---|
| 3
|
| 813
| 615
| 961
| 728
| 641
| 791
| 532
| 625
| 507
| 818
| 1005
| 500
| 594
| 856
| 874
| 724
| 8,7
|
|---|
| 4
|
| 849
| 995
| 1057
| 1094
| 876
| 973
| 909
| 1054
| 1203
| 1057
| 1007
| 824
| 732
| 1053
| 1080
| 984
| 11,9
|
|---|
| 5
|
| 1133
| 913
| 1096
| 1147
| 1090
| 1187
| 1197
| 1040
| 1377
| 1026
| 1180
| 1085
| 778
| 1157
| 1010
| 1094
| 13,2
|
|---|
| 6
|
| 930
| 1006
| 1164
| 1289
| 799
| 1106
| 1004
| 1216
| 1107
| 1083
| 1078
| 1252
| 974
| 1127
| 1117
| 1084
| 13,1
|
|---|
| 7
|
| 1112
| 1336
| 1000
| 1086
| 1086
| 1077
| 1318
| 1173
| 1028
| 851
| 1263
| 937
| 978
| 1049
| --
| 1092
| 13,2
|
|---|
| 8
|
| 1239
| 1120
| 909
| 1150
| 1061
| 885
| 1001
| 1131
| 1059
| 845
| 1139
| 842
| 1037
| 1031
|
| 1032
| 12,5
|
|---|
| 9
| 1
| 851
| 856
| 818
| 785
| 911
| 736
| 911
| 857
| 891
| 836
| 776
| 927
| 684
| 780
|
| 775
| 9,4
|
|---|
| 10
| 3
| 583
| 588
| 539
| 466
| 524
| 480
| 625
| 458
| 353
| 578
| 662
| 495
| 519
| 380
|
| 484
| 5,8
|
|---|
| 11
| 4
| 241
| 183
| 361
| 272
| 283
| 289
| 341
| 265
| 368
| 236
| 326
| 172
| 199
| 279
|
| 255
| 3,1
|
|---|
| 12
| 128
| 120
| 296
| 97
| 276
| 320
| 75
| 184
| 190
| 149
| 129
| 161
| 102
| 110
| 233
|
| 171
| 2,1
|
|---|
| Totals
| 136
| 8559
| 8363
| 8676
| 8835
| 8296
| 8182
| 8754
| 8770
| 8607
| 8044
| 9270
| 7744
| 7048
| 8553
| 5390
| 8284
|
|
|---|
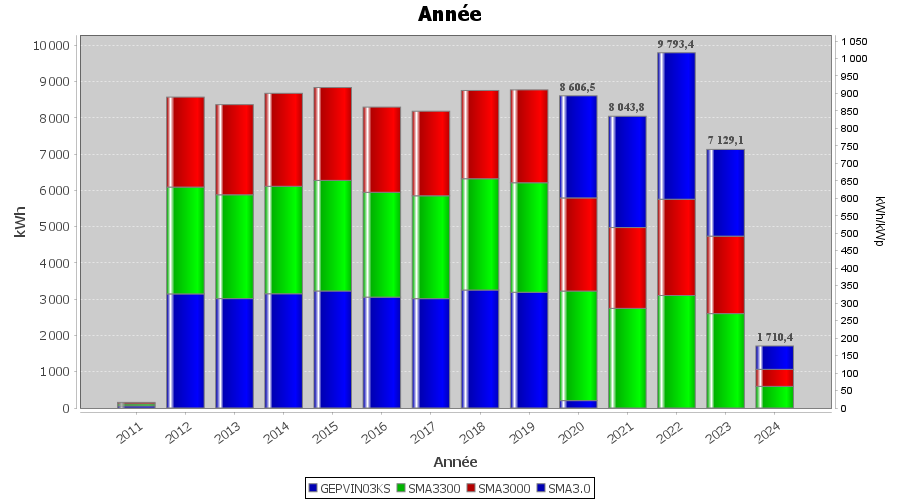
Production totale par onduleur
| Omvormer
| Wp
| Opbrengst
|
|---|
| GEPVIN03KS
| 3525
| 25287
|
| SMA3.0
| 3525
| 20222
|
| SMA3300
| 3290
| 42419
|
| SMA3000
| 2820
| 35296
|